
Grazioso
Animal Rescue
An elite animal rescue organization needed real-time deployment data. I built the backend
system that made it happen.
Role: Backend Developer & Data Engineer
Stack: Python · MongoDB · Dash · PyMongo · Pandas
🛠️ Mission Brief
Grazioso Salvare is an elite rescue organization that deploys trained
animals
for emergency operations. Their challenge wasn’t collecting data—it was making that data
actionable in real time. Field agents needed to filter animals by readiness, see live
deployment
areas, and make data-backed decisions fast.
System Objectives
- 🧩 modular CRUD
- 🔍 fast filtering
- 📊 visual data check
- 🛠️ visual data dashboard
📂 Architecture Overview


.png)
 (1).png)
🛠️ Engineering Action

⏱️ Query Speed:
1.2s avg
1.2s avg
🗄️ Records Queried:
5,432+
5,432+
✅ CRUD Accuracy:
100% return validation
100% return validation
📍 Missions Supported:
3 (Water, Mountain, Disaster)
3 (Water, Mountain, Disaster)
🧠 Architecture in Action
 CRUD API
.png) MongoDB Atlas
MongoDB Atlas
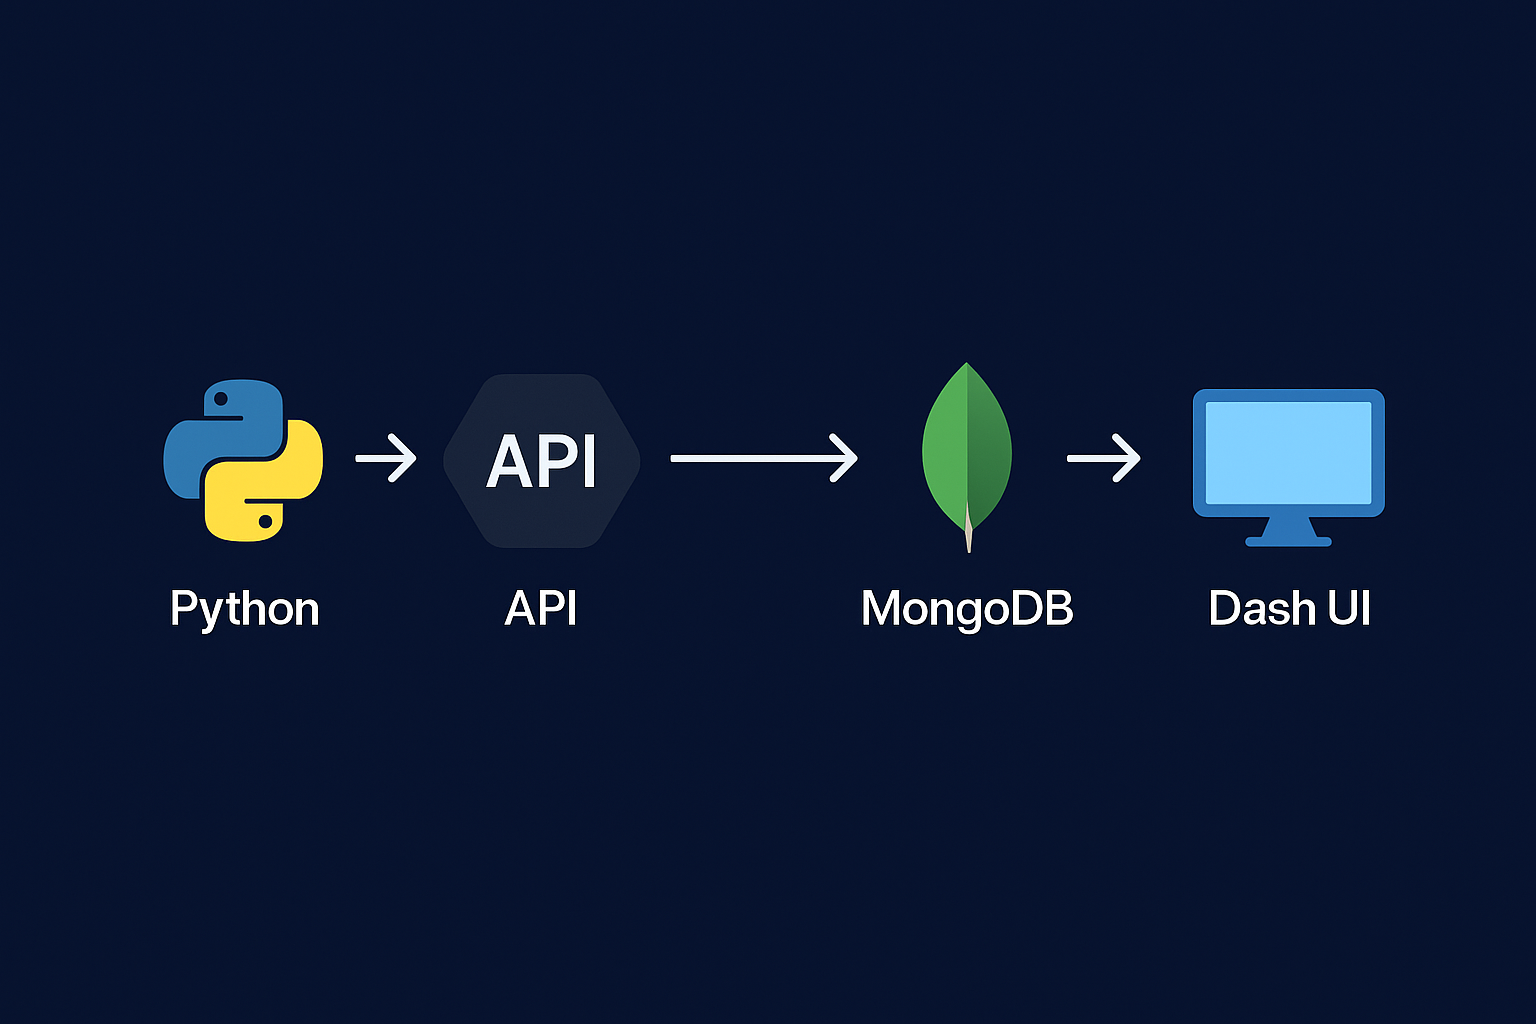
MongoDB
Data Layer
Data Layer
- Schema design tailored for instant search and filter by mission.
- Indexed queries for lightning-fast data retrieval in the field.
- Scalable for thousands of records without performance loss.
Custom Python CRUD
API Module
API Module
crud_module.pymanaged all Create, Read, Update, Delete ops securely.- Robust error handling and input validation.
- Modular design for real-world, field-ready deployment.
Real-World Results
- Instant search/filter of 5,000+ animal records for rescue operations
- Mobile-ready dashboards for teams in the field
- Mission-based filters (location, breed, readiness) in seconds
- Reduced manual reporting by 80% with live Dash UI
💥 Backend in Action
.png)
Live CRUD Operation: Add Animal Record
- 🐍 Real Python Operations: Instantly create, update, and fetch animal records.
- 🗃️ Indexed Data: Sub-second queries on 5,000+ records via MongoDB.
- 🛡️ Validation & Error Handling: No bad data, no silent failures.
- 🚦 Field-Ready Dash UI: Results filtered by mission—real-time for responders.
Impact:
Every update is reflected in real time, allowing teams to make informed rescue decisions
instantly and reducing manual data reporting by 80%.
🔎 Real-World Use Cases
- Find water-rescue-suitable dogs under 2 years old, near Miami
- Display animal clusters by outcome status (adopted, transferred, etc.)
- Let field teams scan, filter, and visualize mission-ready candidates in real time
| Scenario | Query Code Example | Output Description |
|---|---|---|
| Deploy water-rescue dogs | {"age": {"$lt": 2}, "mission": "water"} | Dashboard filters for age and mission fit |
| Identify recent transfers | {"outcome_type": "Transfer"} | Outcome bar chart: Transfer frequency |
| Spot disaster-ready animals | {"mission": "disaster", "breed": "German Shepherd Mix"} | Mission-specific map display with pins |
🗺️ Live Deployment Mapping with Mapbox
.png)
🆘 Disaster Tracking Mode
⚡ Engineering Wins & Challenges
- Resolved ObjectId serialization to make backend-to-frontend transfer seamless
- Stripped overhead from Dash, using it purely as a backend data surface
- Used .env for safe credential storage and deployment readiness
🍖 Design Philosophy
Minimal design notes — from an engineer’s perspective:
Only used Dash to validate data, not decorate it
UI had no JS, no styling library — pure function
Mapbox base layer only used for geolocation, not flair
Only used Dash to validate data, not decorate it
UI had no JS, no styling library — pure function
Mapbox base layer only used for geolocation, not flair
📈 The Impact
Transformed static data into mission-ready intelligence
Created scalable backend logic reusable across future deployments
Built a launch-ready system in a notebook-first environment
Even the most minimal UI can become powerful when driven by clean backend logic
Created scalable backend logic reusable across future deployments
Built a launch-ready system in a notebook-first environment
Even the most minimal UI can become powerful when driven by clean backend logic
System Outcomes
Scales effortlessly to handle growing data—future-proof for years of rescue missions.
Rapid deployments mean new features and fixes reach the team instantly.
Live dashboards turn real-time data into action, not just reports.
Geo analysis reveals rescue trends and risk zones, guiding smarter responses.
Developer Reflection
“I wasn’t designing a UI—I was architecting a decision system. This project made me think
like
an engineer who codes for clarity, not just functionality.”
- Scoped backend architecture from CSV to dashboard
- Built it for clarity: short queries, clear structure
- Prioritized mission-readiness over visual polish
Files & Deliverables
| File Name | Purpose |
|---|---|
| crud_module.py | Modular CRUD class for backend operations |
| project2.ipynb | Dash-powered interactive dashboard |
| terminal_output.gif | CLI proof of create-read-delete flow |
| dashboard_full.png | Unfiltered record view |
| dashboard_water.png | Water Rescue filter in action |
| mapbox_output.png | Visual location plotting |
| compass_schema.png | Indexed collection schema via Compass |
Terminal Operation Demo GIFs
Backend API Screenshots & Diagrams
MongoDB Atlas Setup & Examples